Order Book Depth as a Leading Indicator in Event Markets
How order book depth signals price moves in prediction markets, if you know what to ignore.
Order book depth in an event market isn't a snapshot of who's willing to trade at what price. It's a map of committed capital, at least when the capital is real, and a fair chunk of it isn't. This piece walks through what the research actually says about depth as a signal, why Polymarket and Kalshi complicate that signal in ways equity traders never had to think about, and how to read depth skew, liquidity walls, and vanishing orders without getting fooled by a market that is, some fraction of the time, lying to you on purpose. The position worth stating up front: raw depth is easy to misread. Treating it as gospel when the research says it behaves more like a rumor that happens to be true often enough to matter is a common failure mode.
Start with the object itself. An order book is a queue: resting buy orders (bids) stacked below the current price, resting sell orders (asks) stacked above it, visible in real time to anyone who bothers to look. A price chart tells you what already happened. The book gestures at what's about to happen, which is a different job entirely, and most retail traders, in equities and event markets alike, spend all their attention on the candle and ignore the queue sitting right next to it. That's backwards. The research below explains why.
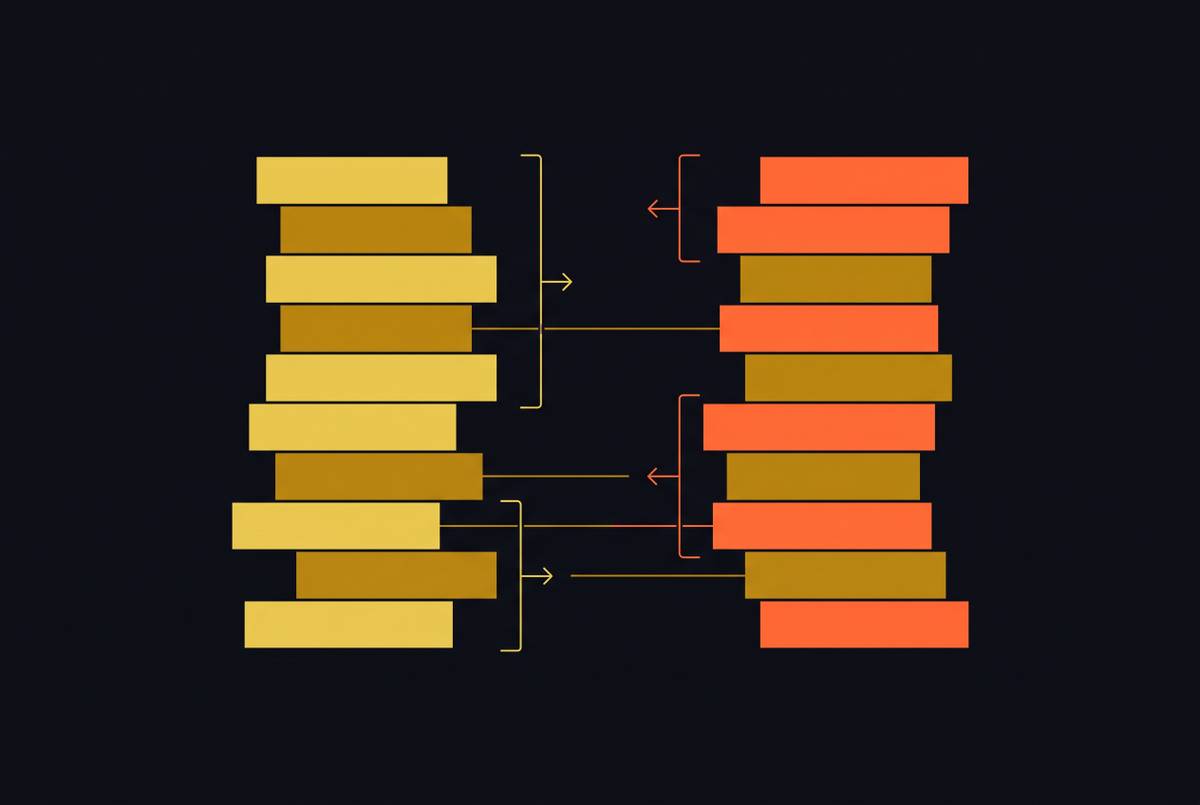
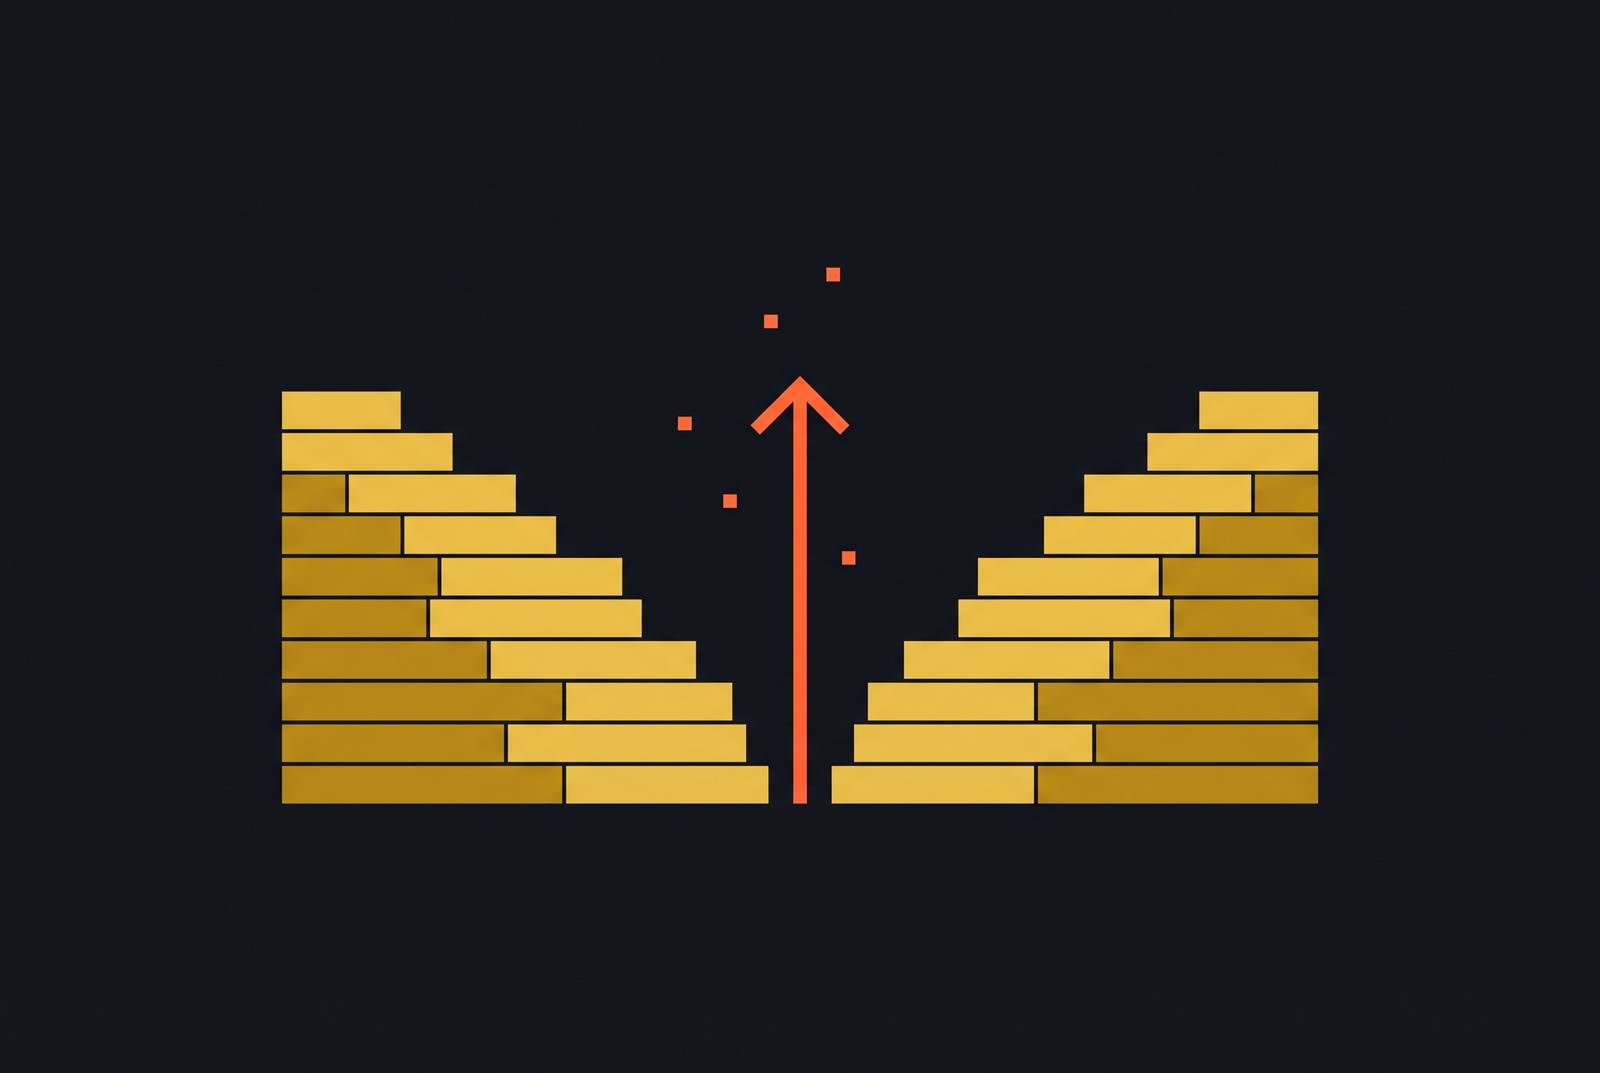
Depth skew is the measurable imbalance between total bid-side volume and total ask-side volume across a defined price range. Heavy skew toward bids means latent demand is sitting there waiting to absorb whatever sell inventory shows up, which puts upward pressure on price. Heavy skew toward asks means sellers are more aggressive, and the odds of a near-term decline go up. Traditional support and resistance levels are historical guesses about where buyers or sellers showed up before. Depth shows where capital is sitting right now: a different category of evidence, not just a fresher version of the same one.
Reading only the best bid and ask, what traders call top-of-book, misses most of this. Does volume cluster near the current price and thin out fast, or stay roughly even across ten price levels? When the average distance between buy orders and the best bid runs wider than the equivalent distance on the sell side, that asymmetry suggests sellers may be clustered tighter and more aggressive, which can put downward pressure on price. None of this needs a dataset to understand. It's the scaffolding for everything below, and it's also the part most people skip on their way to the chart.
What the academic research confirms about order book imbalance as a short-term price predictor
Order Book Imbalance, OBI for short, formalizes depth skew into something computable: the relative difference between bid-side and ask-side volume, measured at one price level or aggregated across several. Research into imbalance-adjusted mid-price metrics suggests they can outperform both the raw mid-price and the volume-weighted mid-price as short-term predictors, with signal strength concentrated over short forecast horizons. Narrow window, but not a coin flip: low-OBI regimes correlate with a higher probability of the mid-price falling, high-OBI regimes with it rising. The direction holds up statistically inside that window, for that horizon, and nobody has claimed it holds much longer than that.
Going beyond a single price level adds more. Research into multi-level order book imbalance suggests a 5-level measure discriminates better than a 1-level one, and folding depth across multiple price tiers improves both in-sample fit and out-of-sample prediction. More levels, sharper signal, though the gains are incremental rather than explosive. Nobody should expect a 5-level model to turn a coin flip into a sure thing.
A 2025 study of NASDAQ's deep limit order book (Briola, Bartolucci, and Aste, in Quantitative Finance) adds a mechanical detail that borders on comedy once it clicks: the study identifies patterns consistent with liquidity takers timing trades for moments when the opposite side's volume runs relatively high, which is exactly what you'd expect if OBI were a signal sophisticated traders already exploit. The same study throws in a caution worth repeating: high forecasting accuracy doesn't automatically mean the signal is tradable. Each asset's own microstructure quirks decide whether the prediction turns into anything a trader can actually capture before someone faster does.
There's a multiplier effect too. Research on order book dynamics finds price sensitivity runs inversely proportional to market depth: thin books amplify price moves. Depth isn't only directional, it's a volatility dial, and turning it down means the same order flow produces a bigger swing. Analysis of U.S. Treasury market turbulence in early April 2025, following the tariff announcement that rattled bond markets, relied on order flow imbalance monitoring to judge whether liquidity demand was outrunning supply. That's the deepest, most liquid market on the planet leaning on the same tool this piece applies to prediction markets, a fraction of Treasury's size and a fraction of its scrutiny.
How event markets are structurally different from equity and futures markets, and why that changes what depth signals mean
Prediction markets in 2025 and 2026 run on several main structures, including the central limit order book (CLOB), automated market maker designs, and the parimutuel pool. Polymarket and Kalshi both use CLOBs, so in principle the depth-reading techniques built for equities transfer over. In practice, the contract underneath changes what depth even means, and this is where equity habits start misfiring quietly.
A binary prediction contract pays out between 0 and 1, full stop. There's no open-ended price axis the way there is for a stock that could theoretically run to $10,000. That boundedness creates focal points continuous markets don't have: the 0.50 mark, the 0.25 and 0.75 quartiles, the edges near 0 and 1. Traders cluster attention and resting orders around these levels in a way nobody clusters around, say, some arbitrary price on an equity chart. Everyone remembers the round numbers on a highway mile marker. Nobody remembers mile 213.
Time-to-resolution is the other wrinkle, and equities have nothing like it. A wide spread on a market resolving in three weeks supposedly means something different from a wide spread on a market resolving in three hours. Books thin as resolution nears, in theory, because a stock doesn't expire and a prediction contract does. That lifecycle story sounds airtight. The Polymarket microstructure study addresses it directly later in this piece and finds the evidence doesn't support it as a general rule. Worth flagging now: anyone building a rule around "spreads widen near expiry" is building on a story the data contradicts.
Attention is unevenly distributed too. A presidential election draws institutional market makers who keep spreads tight because the volume justifies the labor. A market on a niche regulatory ruling or a small college sports outcome trades wide and shallow for most of its life, because nobody's competing to make markets in it. Most markets on both Kalshi and Polymarket carry total trading volume below $10,000, meaning one participant placing a single sizable order can move price by double digits in percentage terms. In the thin ones, "depth" might mean one guy with a laptop, not a crowd of institutional capital. Treating those two situations the same way is the first mistake most newcomers make, and it's a mistake worth naming plainly rather than softening: if you can't tell which kind of market you're looking at, don't trust the book yet.
That produces the realized-spread problem. A market can show a tight two-cent spread at the top of the book and still cost a trader six cents of slippage on any position large enough to matter, because the book empties out fast past the first level. The quoted spread and the tradable spread are different numbers, and event markets stretch that gap wider than most equity traders expect.
The scale and institutional legitimacy that make event market order books worth studying seriously in 2025–2026
None of this is worth the analysis if event markets are still a curiosity. They aren't, not by volume and not by who's backing them now.
Polymarket ran $73 million in total volume in 2023. In 2024, driven largely by the U.S. presidential race (over $3.3 billion wagered on the Trump-Harris matchup alone), that figure jumped to roughly $9 billion. The first half of 2025 alone saw around $6 billion in prediction volume on the platform.
Then the institutional money showed up formally, and this is the detail worth sitting with longest. In October 2025, Intercontinental Exchange announced a strategic investment of up to $2 billion in Polymarket at roughly an $8 billion pre-investment valuation, with ICE becoming a global distributor of Polymarket's event-driven data, feeding sentiment indicators built on prediction-market pricing to its own customers. Kalshi raised approximately $1 billion at a $22 billion valuation in a round led by Coatue Management. That's not speculative money chasing a trend. That's the kind of capital that shows up once institutions decide a market structure will still be standing in five years, and it raises the cost of getting the depth-reading wrong.
Both platforms expose order book and trade data through public APIs. Kalshi documents a market-maker program, a liquidity incentive program, and a volume incentive program. Polymarket documents CLOB data access directly. The depth signals in this piece aren't behind a paywall, they're sitting in an API response anyone with a bit of coding patience can pull. So why isn't everyone already trading this way, given the data's public and the capital is real? Part of the answer, and the part the next section makes plain, is that the data is trickier to read than it looks, and most people pulling it don't know what they're actually looking at.
What the first rigorous microstructure study of Polymarket found about how depth actually behaves on-chain
Dubach's 2026 study is the first genuinely rigorous look at Polymarket's microstructure, and it's a serious dataset for a market that's only a few years old: a continuous tick-level archive of the public order book feed, roughly 30 billion events across 52 days, cross-referenced against the on-chain trade record, applied to a pre-registered stratified panel of 600 markets.
The study reports eight stylized facts, but one matters more than the rest here. Depth on Polymarket runs closer to uniform than concentrated at the best quote: resting liquidity spreads across price levels instead of piling up at the top of the book. Different profile from the equity microstructure literature, where depth concentration patterns differ from this more uniform spread.
The second finding is the one worth taking a position on, because it cuts against intuition directly. Once duration, price level, and volume are controlled for, depth does not systematically decay as a market nears resolution. The "thinning near expiry" story gets repeated as though it's settled, and it isn't, once the confounding variables get separated out. What matters more is the market's overall volume level and where price sits, not the countdown clock. Anyone treating time-to-close as a reliable trigger for reading depth differently is trading a superstition, not a finding, and it's worth saying that bluntly since the superstition is common.
Then there's the result that should make anyone porting equity-market habits into Polymarket sit up straight. Feed-inferred trade direction (guessing whether a trade was buyer-initiated or seller-initiated from the order book feed alone) agrees with on-chain ground truth only about 59% of the time on comparable buckets. Compare that to roughly 80% accuracy for the Lee-Ready algorithm on equities, the standard benchmark for trade direction inference. Sign-flip rates hit 67% on effective half-spread estimates and 60% on Kyle's lambda (a standard measure of price impact) when feed-inferred numbers are checked against on-chain truth. Standard microstructure tools, dropped into Polymarket without adjustment, get direction wrong more than a third of the time. Anyone reading these books with equity instincts is working with a degraded signal, and most don't know it.
One more wrinkle worth flagging: maker-wallet diversity looks broad on the surface, but the tail is concentrated. Plenty of wallets provide liquidity, sure, but a small number account for a disproportionate share of it. Depth that looks democratically distributed can still be run by a handful of actors underneath, which matters for everything in the next section.
How spoofing and phantom liquidity distort depth signals in bounded-payoff markets
Spoofing is an old trick in new clothes here: post a large resting order with no intention of filling it, let other traders treat it as support or resistance, cancel before price gets close enough to force a fill. It works in any market with a visible book, but event markets are an unusually comfortable habitat for it. The position worth stating plainly: treating raw depth totals as reliable on these platforms without checking for this isn't a shortcut, it's a mistake, and the study above already shows why the shortcut fails.
Why such a comfortable habitat? Because the bulk of resting depth in Polymarket's books sits outside the near-mid region, in deeper out-of-the-money territory. A spoof order placed that far out costs the manipulator nothing in real fill risk, yet it's fully visible to anyone summing total book depth. It's the market equivalent of hanging a "Beware of Dog" sign with no dog behind the fence. The bark of the order book is entirely optional, and plenty of traders never check whether there's an actual animal back there.
The binary structure hands manipulators natural targets on top of that. The 0.50 mark, the 0.25 and 0.75 quartiles, the boundary near 0 or 1: these are exactly where other traders are already looking, because they're the psychologically loaded levels in a bounded-payoff contract. The bounded, discrete structure of binary contracts creates focal points that continuous-underlying markets like stocks don't share in the same way.
The clearest tell is disappearing liquidity: a wall of resting orders that vanishes as price approaches it, instead of getting eaten by actual trades. Real support gets consumed. Fake support evaporates right before contact, like a mirage that only holds up from a distance. Distinguishing the two means watching order flow alongside the depth snapshot, never trusting either one alone.
Dubach's study also flags wash trading: self-counterparty trading, where the same actor effectively trades against themselves to inflate apparent activity, carries a median share of just 1% of volume across markets, but an upper tail reaching 22% in some. Depth propped up by that kind of activity is unreliable on top of everything else already covered. Treat a thick wall on the bid side as a hypothesis worth testing, never a settled fact, until order flow confirms it's genuine. Depth skew only leads price when the liquidity behind it is real, and real, on these platforms, has to be earned through verification, not assumed from a screenshot.
When depth and volume point in opposite directions, and what that divergence itself reveals
Sometimes depth and volume tell two different stories at once, and the disagreement between them carries more information than either number alone.
CME Group's read on E-mini S&P 500 futures during the early April 2025 tariff volatility is instructive here, even in a futures market rather than a prediction market. Order book depth fell 68% relative to the prior week, while volume on April 7 came in over 99% higher than the Q1 2025 average daily volume. A trader looking only at depth would conclude liquidity had evaporated. A trader looking only at volume would conclude liquidity had never been stronger. Both would be half right, which is exactly the trap: reading just one number is how traders get blindsided during the fast part of a move.
CME's explanation gets at the mechanism. In fast-moving periods, market makers refresh quotes at the top of the book more rapidly, so low resting volume at any given instant doesn't necessarily mean low liquidity overall. It can mean high refresh velocity instead. Fill quality, meaning how much price impact a trade actually causes, becomes the more honest measure in these regimes than a static depth snapshot. During that same episode, fill quality degraded: fill quality degraded by 6.7 ticks during the week of April 7 compared to the week of March 17. The real cost of trading showed up in execution, not in the book.
Worth a side note, because the comparison is almost reassuring: stacking April 2025 against the March 2020 COVID crash, the basis-point impact of a large notional trade in 2020 ran 10 basis points, versus 5.4 basis points for a larger notional trade in 2025. Market structure genuinely improved, even under comparable stress.
The Federal Reserve's framing of the Treasury episode captures the tension: volatility spikes liquidity demand at the exact moment market makers pull back risk exposure, and that mismatch, not the depth snapshot by itself, is the signal worth tracking. Translate that to event markets and the warning gets concrete fast. During a fast-breaking news event on Polymarket or Kalshi, a book that suddenly looks thin may just mean market makers stepped back for a few seconds to reassess, not that the market reached any kind of consensus. Reading depth as directional during the shock itself is probably the single worst moment to try it.
One partial remedy: watch both platforms at once. If Kalshi and Polymarket price the same event differently during a volatile stretch, that gap is data. Sometimes it reflects one platform's liquidity temporarily drying up, sometimes a genuine disagreement about the probability itself. Either way, the discrepancy tells more than either single number does alone.
How to read depth skew, liquidity walls, and order disappearance as a structured sequence of signals
Put the pieces together and a sequence shows up: three signals that build on each other, not three separate things to eyeball independently, and the order matters more than people assume.
Start with depth skew, the ratio of bid-side to ask-side volume within a defined range of the current price. Bids minus asks, divided by bids plus asks, produces a normalized number running from strongly negative (seller dominance) to strongly positive (buyer dominance). This is the coarsest signal and the easiest to compute. It's also the easiest to fake, since it doesn't distinguish real orders from spoofs sitting far from the mid, which is exactly why it can't be the last word on its own.
Next, the liquidity wall check. A genuine wall persists across multiple snapshots over time and usually has some counterpart on the opposing side, even a smaller one. A fake wall, the spoofed kind, tends to appear suddenly, sit isolated, and show no comparable structure on the other side. Patience matters more than speed here: watching the book across several minutes tells you more than one screenshot ever will.
Last, order disappearance, the sharpest signal of the three. When a bid wall dissolves as price approaches it instead of getting consumed by actual trades, whatever support it appeared to offer was never real. That's the tell separating structural liquidity from theater, and it's the one signal in the sequence that doesn't require guessing.
Two refinements worth layering on. Distance-weighting matters: liquidity near the best bid or offer carries more predictive weight than an equivalent volume parked deep in the book, which is why serious quantitative approaches weight by proximity to the BBO instead of summing raw volume across every level. And at the simplest level, the research cited earlier suggests Level 1 volume imbalance alone, paired with bid and ask prices, comes close to matching the predictive power of the full Level 1 dataset. The imbalance does most of the work, not the absolute size of the numbers.
None of this turns depth reading into a crystal ball, and it shouldn't be sold as one. Dubach's finding that Polymarket's depth skews more uniform than top-heavy, combined with the roughly 59% accuracy of feed-inferred trade direction, means every signal here needs some humility about how often it's wrong. The more honest way to use market depth: treat it as one piece of evidence weighed against volume, against time-to-resolution, and against the real possibility that the wall staring back from the screen isn't a wall at all.