Weather Data as a Predictor of Totals Line Movement
Weather forecasts move NFL totals in a predictable sequence, and timing your bet to it is the edge.

- Written by
- Ignacio Rondon
- Updated
- November 9, 2026
- Reading time
- 13 min read
- Sources cited
- 8 sources ↓
What this covers
Weather Data as a Predictor of Totals Line Movement.
Why weather moves totals and not spreads
Weather forecasts don't just shave points off a total. They set off a sequence of line moves that starts the moment a game opens and doesn't finish until kickoff, and the reader who understands that sequence can position ahead of it rather than reacting to it. The starting point is a basic asymmetry: weather is one of the forces that move lines, but it acts almost exclusively on totals, not sides. A total, on the other hand, reflects the combined scoring output of both offenses, and that number is what wind, rain, and cold suppress.
Weather is one of five recognized forces that move betting lines, and it's nearly unique among them for acting almost entirely on the total rather than the side. Wind is the reason. It hits the two most efficient scoring mechanisms in football at the same time: the deep passing game and the field goal. A quarterback's timing on a rhythm route depends on the ball arriving where the receiver's break says it should, and a ball in the air for three seconds spends all three of those seconds getting pushed off its line by crosswind. Both effects land in the same game, which is what separates wind from every other weather variable in the sport.
Rain adds a second, distinct layer of drag. It doesn't create an advantage for one side or the other so much as degrade the mechanics that both offenses depend on: grip on the ball, footing on cuts, and the fine motor control that route running requires. None of this touches the spread in a meaningful way. It touches the total, directly and repeatedly. Understanding this asymmetry has to come before anything else in reading a weather-driven line move.
How sportsbooks build weather into opening lines
Books don't set opening numbers by hand anymore. Modern operations run software, machine learning models, and dedicated analyst teams to build the opening line, and the process moves faster and pulls in more data than it did even a handful of years back Covers Odds Index. But speed doesn't solve the fundamental problem facing anyone pricing an outdoor game a week out: the forecast itself isn't reliable yet. Weather models five to ten days from kickoff carry wide uncertainty bands, and a book can't price conditions that current meteorology can't yet resolve. That gap is where the opportunity for an attentive bettor starts: acting in the window before the forecast narrows enough for the book to react to it.
Books aren't blind to this, though. Where a known weather risk already sits on the calendar, it gets baked into the opening number early. That's a book hedging against a known seasonal pattern, not reacting to new information. It matters because it shows the opening line already carries some weather assumption even in the total absence of a forecast, which means the bettor's job isn't to spot that a cold-weather game might get windy. It's to catch the moment the market moves from assumption to confirmation.
Sharp money complicates the picture further. A professional who has circled a game for its weather potential can bet into it before any forecast-driven adjustment has been made, and that early action can trigger a line move that looks, on the surface, like pure sharp betting when it's really a bet made in anticipation of weather that hasn't been priced yet. Ed Salmons of the Westgate SuperBook, per weatherimpactonnflbet.com, notes that totals for games in historically cold cities (Cleveland, Buffalo, Pittsburgh, Foxborough) start dropping after Thanksgiving "just in case the weather is crappy," illustrating pre-emptive adjustment even before a firm forecast exists.
The sequenced chain of line movement from open to close
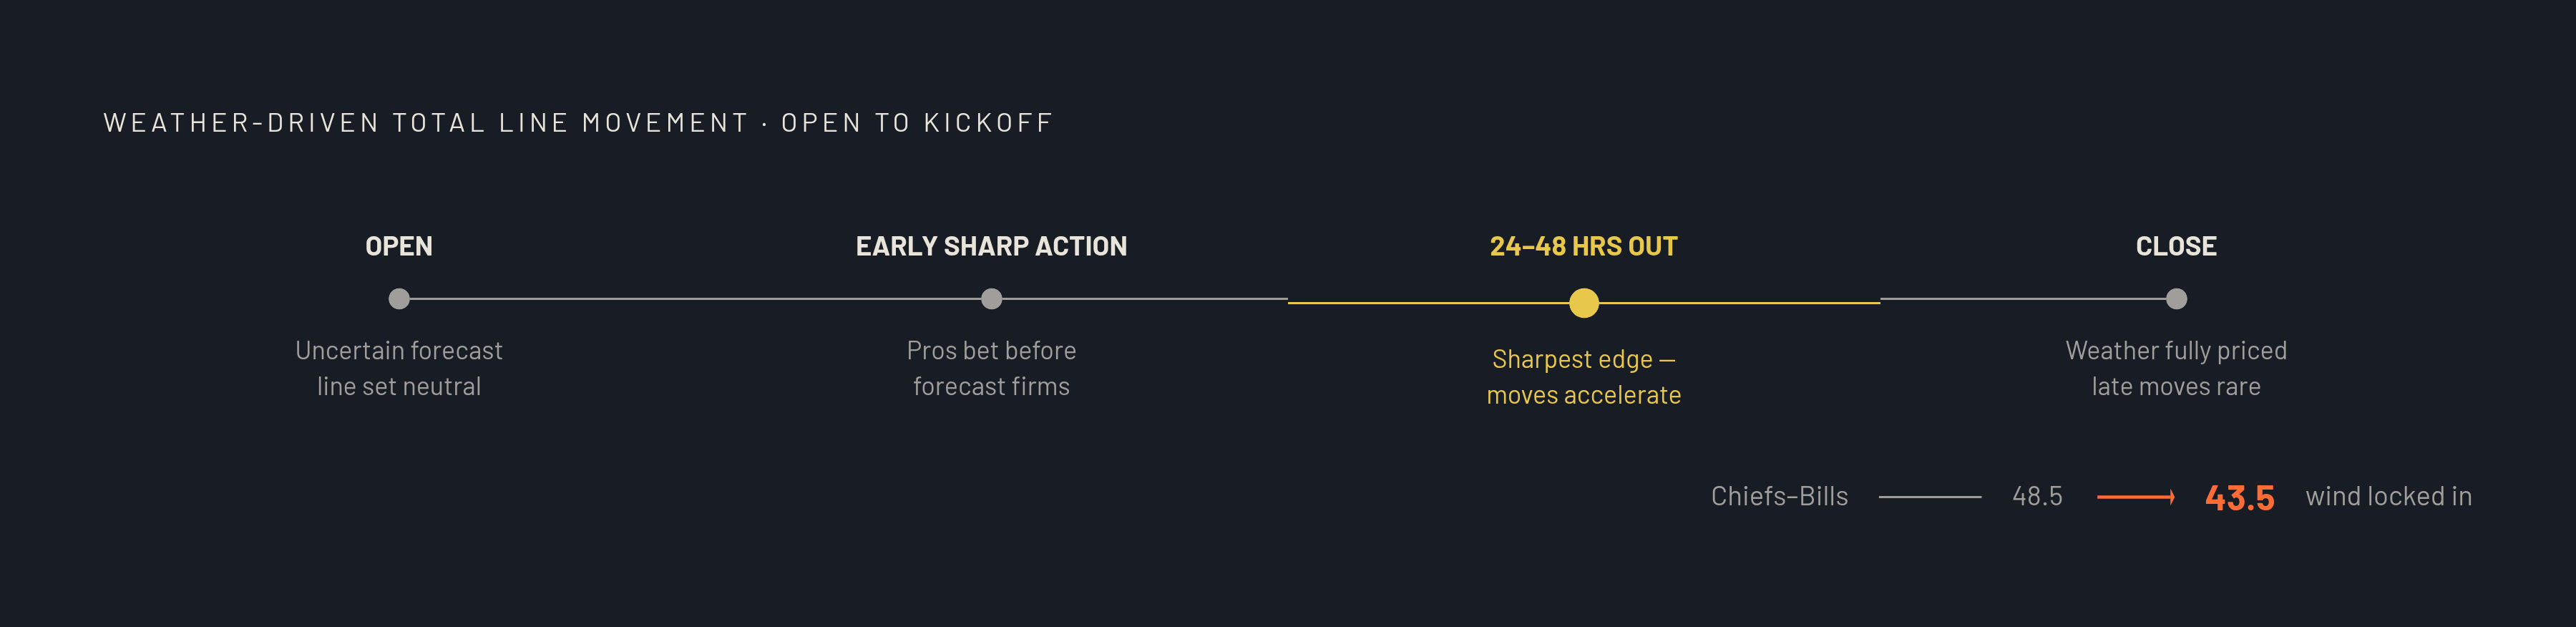
Line movement is simply the gap between the number a book opens with and the number it closes with, and that gap tells a story about who moved money and when. In the Close phase, lines in the 24-hour window before kickoff carry the most current, relevant information, injury and weather both, and this is where weather that developed late gets fully priced Covers.
The line opens under an assumption of neutral or moderately uncertain conditions, built from offensive and defensive modeling rather than any specific forecast. Then comes the phase where professionals who've already circled a game with weather upside get their bets in early, ahead of the forecast firming up, and those bets force the book to adjust immediately. Speed is the tell here: a line that moves within minutes of opening was hit by sharps who had the number circled in advance, and a single large sharp wager can move a total faster than a much larger pool of public money ever could.
The third phase is where the real action concentrates. Roughly 24 to 48 hours before kickoff, forecasts sharpen enough that both the books and the sharp bettors start reacting to a narrowing confidence interval rather than a wide one, and this is when weather-driven moves accelerate most visibly Odds Index. By the close, the line reflects the most current information available, injury and weather both, and any weather development that showed up late in the week gets fully priced into the number in that final 24-hour window Covers.
The magnitude of these moves can be substantial. In one outdoor December matchup between the Chiefs and Bills, sustained wind of 25 mph with gusts to 35 mph pushed the total from an opening line of 48.5 down to a close of 43.5, a five-point drop driven almost entirely by the wind forecast solidifying over the course of the week Odds Index Odds Index. Early weather reports tend to trigger the sharp money first, and the line stabilizes only once the picture is fully clear and priced in. The real window of opportunity sits in that middle stretch, after the first reports land but before the market has fully absorbed them.
Reverse line movement is one signal worth tracking through all of this. If most public tickets sit on the over but the total keeps sliding anyway, that tells you sharp money, likely weather-informed, is outweighing the sheer count of public bets, even though it's the smaller number of tickets.
NFL wind: the thresholds that move totals and the historical rates behind them
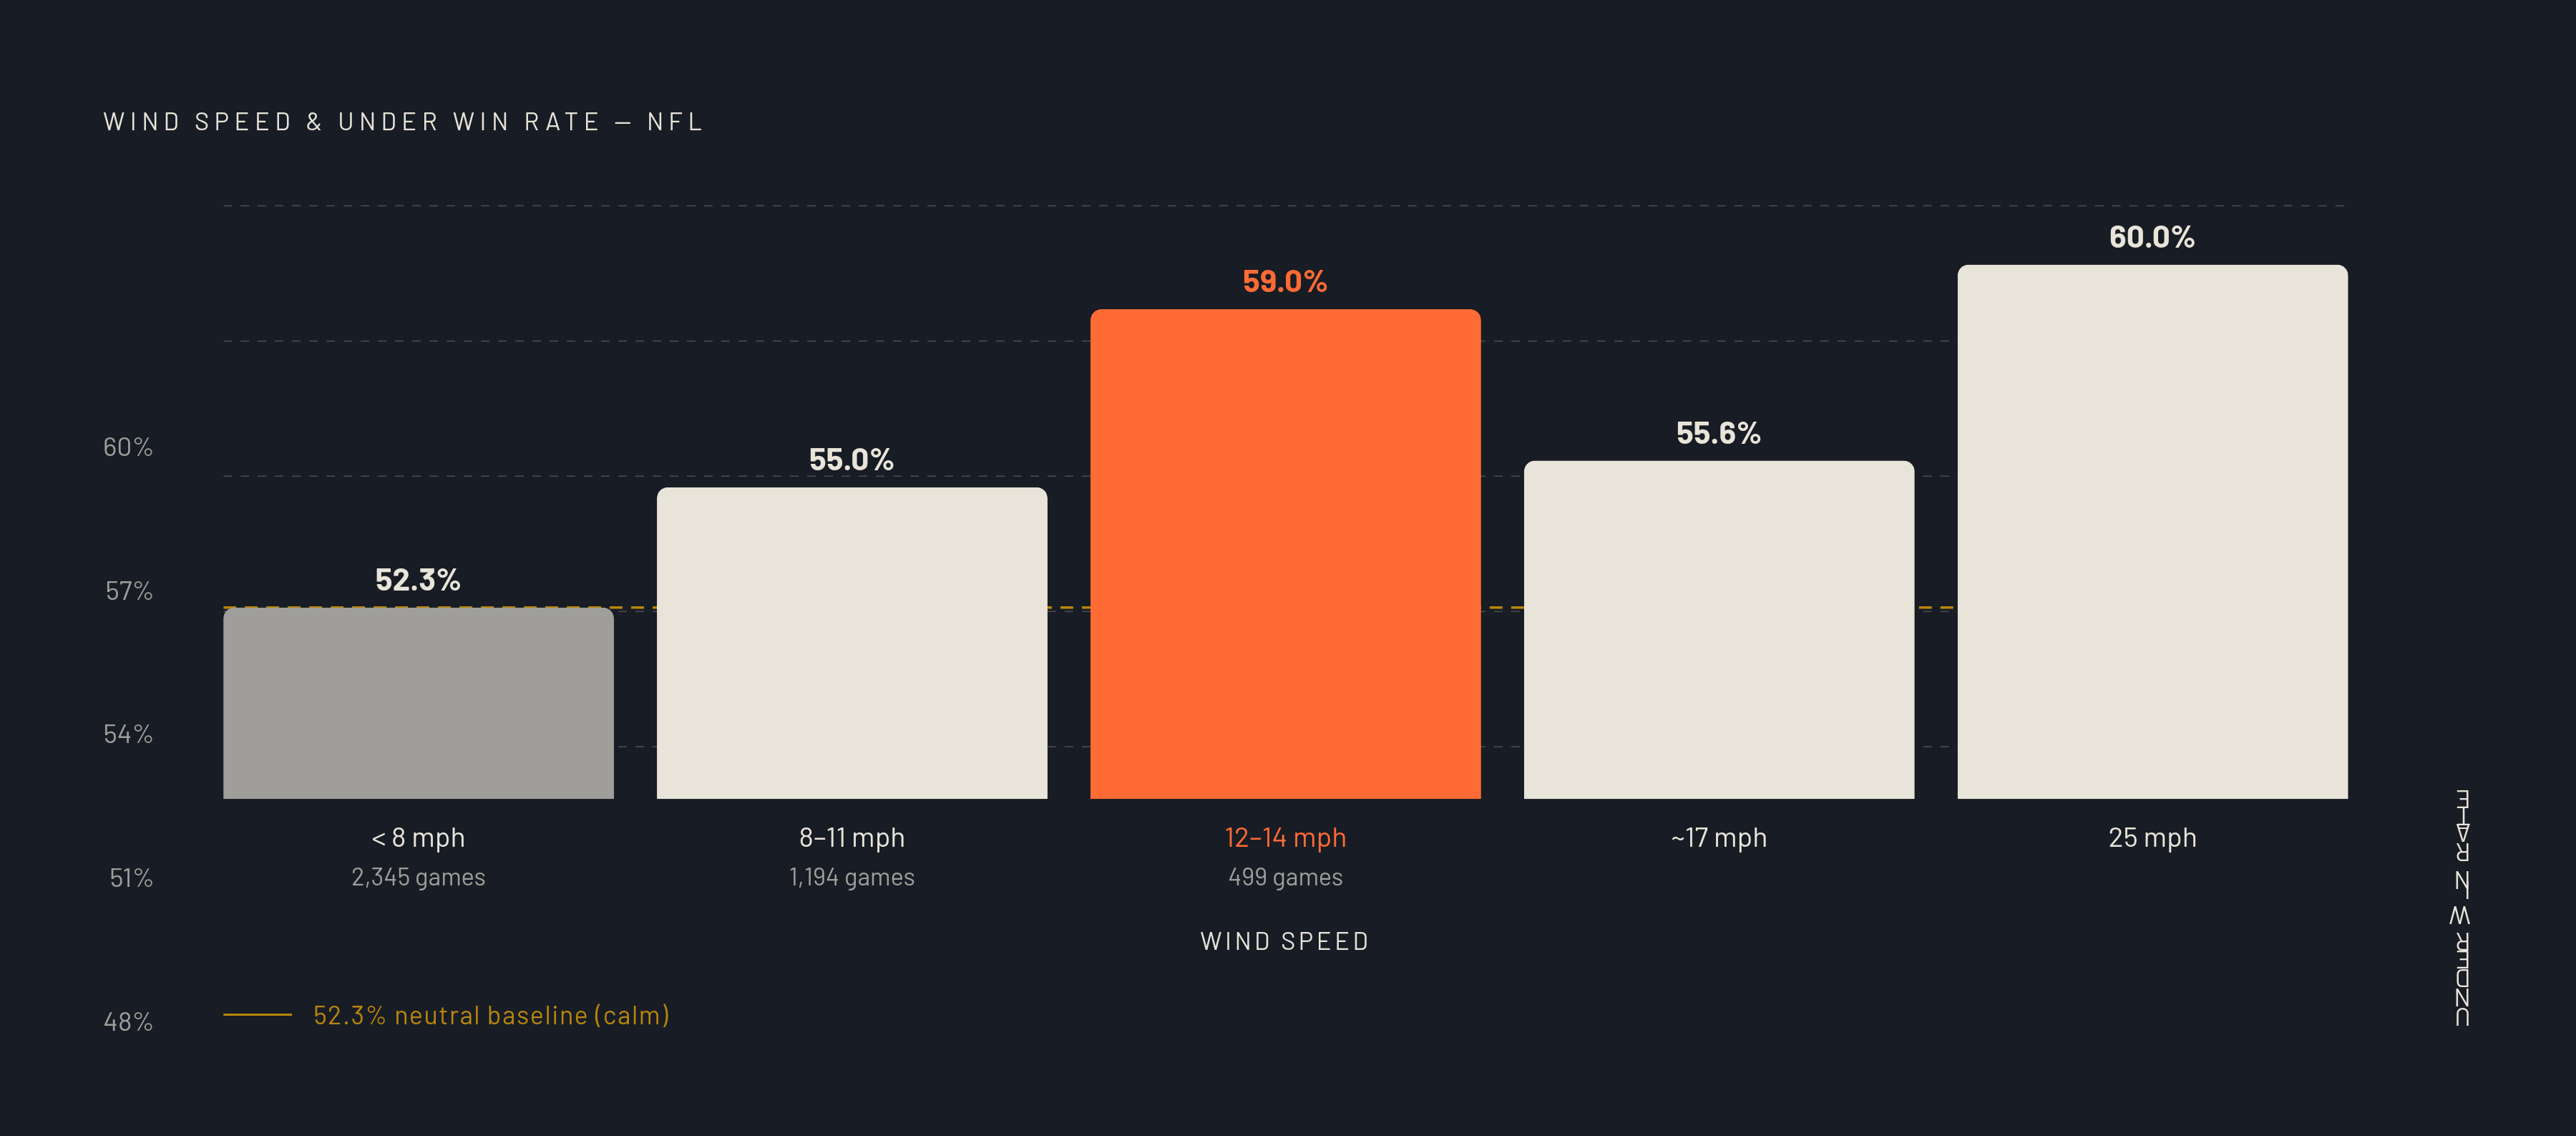
Start with the baseline. In outdoor games with wind under 8 mph at kickoff, the over has hit 52.3% of the time across a sample of 2,345 games, and that number is the neutral condition every wind threshold below gets measured against NXT Bets Sharp Football Analysis. The market's response kicks in earlier than most bettors assume, with meaningful reaction starting around 8 mph. In the 8 to 11 mph band, unders have hit 55% of the time across 1,194 games Heat Check HQ Sharp Football Analysis. At 12 to 14 mph, unders climb to 59% across a smaller but still substantial sample of 499 games Sharp Football Analysis.
The pattern holds as wind climbs further. At an average of 17 mph, under probability rises to 55.6%, and at 25 mph it reaches 60% Pinnacle. Separately, research on games at 20-plus mph puts the under's win rate at 54% since 2015, though another source pegs it above 55% for the same wind band FOX Sports. Either way, the direction is consistent and the magnitude holds across the cited ranges.
Kicking specifically takes a hit in the 15 to 20 mph range, where field-goal success rates drop by roughly 3% NXT Bets Covers. And the market does adjust for some of this on its own: the average total for games in the 15 to 19 mph range is roughly 1.5 points below the average for calm-weather games Sharp Football Analysis Odds Index. But the historical under rates in that same wind band run higher than a 1.5-point adjustment would fully explain, which suggests the market's correction is real but incomplete, and that's exactly the gap a bettor tracking wind forecasts closely can exploit Sharp Football Analysis Odds Index.
Recent examples show how this plays out on an actual slate. A Week 3 matchup between the Chargers and Bills carried a forecast of 14 mph wind with gusts to 24 at Highmark Stadium, rating a Weather Impact Score of 3 out of 5, moderate, though the venue's newness meant there wasn't yet a deep historical sample specific to that stadium at comparable wind levels. The same week, Bengals at Steelers carried 13 mph wind with gusts to 24 at Acrisure Stadium, also scored a 3 of 5, and historical data at that venue under comparable conditions showed the under hitting 55% of the time across 20 games Heat Check HQ.
NFL rain, snow, and temperature: separating real effects from popular myth
Rain has a measurable, well-documented drag on scoring. Teams playing in rain since 2020 have averaged 15% fewer passing yards than their baseline, and games with measurable rain at kickoff have gone under 57.4% of the time across a 343-game sample Sharp Football Analysis Heat Check HQ. The severity of the precipitation matters too: light rain or snow correlates with roughly two fewer combined points, moderate rain with four fewer, moderate snow with six fewer, and heavy rain or snow with six to ten fewer points depending on which of the two it is.
Snow needs a distinction most bettors skip past. Light snow barely touches overall scoring, though it still complicates the kicking game, with field goals in snow converting at 76%. The real scoring suppression appears in heavy snow, and treating all snow as equivalent misses the size of that gap.
Temperature is where popular belief runs ahead of the data. Cold by itself is rarely a sound reason to bet the under, mostly because the coldest games also tend to be the windiest ones, and it's the wind doing the work rather than the thermometer reading. In fact, sub-zero games with no wind and no snow have favored the over in 60% of cases, a result that runs directly against the instinct most bettors have when they see a frigid forecast. There's academic support for a temperature effect elsewhere in the game, though it doesn't apply to totals: a peer-reviewed study in the journal Temperature, examining NFL games from 2017 to 2025, found that northern-state teams' win probability actually decreased as game-time temperature rose, with an odds ratio of 0.974 and a p-value of.026. That's a real, statistically grounded finding, but it speaks to spread and win probability, not to how many points get scored.
20 of the NFL's 32 stadiums are exposed to outdoor conditions, and over the last decade, dome games have averaged roughly 46 points per game compared with roughly 42.5 for outdoor games Pinnacle. Week 3 offered a live look at compound conditions: Seahawks at Commanders carried 12 mph wind, gusts to 29, and rain, rating a 3 out of 5 on the Weather Impact Score, while Titans at Giants carried 11 mph wind, gusts to 28, and rain, rating a milder 2 out of 5.
MLB totals and weather: how wind direction changes the entire calculus
Wind still runs the show in baseball, but the mechanics flip completely, reversing rather than merely changing. In football, wind only ever suppresses scoring. In baseball, direction decides whether the total should go up or down. Wind blowing in does the opposite, and does it with unusual consistency: across 15 years of tracked data, the under has won more than half the time in every year but one Odds Jam.
A hypothetical illustrates the scale. An opening total of 8.5 runs could close at 10.5, a two-run swing driven entirely by wind direction and speed. Compare that with the NFL's example of adverse wind dropping a total by 5 points. Same underlying mechanism, the market reacting to a forecast that sharpens over the course of a week, but the direction of the effect is the exact opposite depending on the sport.
Temperature plays a role too, though a shrinking one. Altitude sits apart from all of this as a fixed condition rather than a forecast-driven one. Coors Field, at around 5,200 feet, sees baseballs travel roughly 5% further than they would at sea level, and the park has led the league in runs and home runs as a result. It's an edge that runs through every game played there, well beyond any single weather window. It's a permanent fact of the ballpark that shapes how every other weather variable interacts with it.
Rain works differently in baseball than in football, too. Roughly 2 to 3% of MLB games each season get postponed or shortened by weather, and rain's effect before a game reaches that point runs through grip and pitch command rather than route-running mechanics NXT Bets Odds Trader. A pitcher who leans on spin and a sharp breaking ball is far more exposed in wet conditions than a power arm throwing mostly fastballs NXT Bets Odds Trader. And the window to act on late-breaking baseball weather closes faster than it does in football. Once news of a shift breaks, the gap between that news and the line's full adjustment shuts quickly. Shopping across books in that narrow window is where the edge lives. Wind blowing out at 10+ mph means fly balls carry further, home run probability increases, and extra-base hits are more likely; at 15+ mph the effect moves expected totals by 1–2 runs, per heatcheckhq.io (Odds Index). Temperature matters too: hot weather (90°F+) means the ball travels farther, resulting in more home runs and more runs scored, per oddsjam.com, but oddsmakers are aware and adjust accordingly, so the edge requires finding a book that hasn't yet updated.
Closing line value as the measure of whether a weather read was sharp
The closing line is the sharpest price on the board, because it folds in every piece of information and every dollar wagered right up to kickoff. Bettors who consistently beat that closing number got a better price than the market eventually settled on, and they tend to be profitable over the long run, which is the core reason closing line value gets treated as the standard measure of whether a bet was actually well-timed rather than just lucky.
Weather bettors have a specific version of that test. Did the bet land before the weather got priced in, and did the line subsequently move in the direction the forecast implied? A yes on both counts is evidence of a repeatable process. Waiting until the forecast fully resolved and betting into an already-adjusted number means paying full price for information the market already had, which produces no closing line value at all.
A total that keeps dropping right up to kickoff means the weather picture was still developing, and that late movement is itself a signal worth reading rather than ignoring. A move's location matters too. A shift at a market-making book that gets echoed across other sportsbooks is a cleaner signal of genuine market consensus than a move at a single recreational book, which might just reflect that one book managing its own liability rather than reacting to weather at all. The closing line is the most efficient price, incorporating all information and betting activity up to tip-off or kickoff, per oddsreference.com, and Pinnacle's research on closing line value (per Pinnacle Betting Resources, as cited by oddsreference.com) confirms that bettors who consistently beat the closing line are profitable long-term. Weather bettors have a specific CLV test: did you get the total before the weather was priced in, and did the line move in the direction the forecast implied? If you waited until the forecast was fully resolved and bet into the already-adjusted number, you have no CLV; you paid for what the market already knew. The 25–48-hour window before kickoff is when forecasts solidify and lines move most aggressively, per oddsindex.com (a bettor acting before that window has the best chance of beating the close, while one acting inside it is increasingly paying the adjusted price). Per outlier.bet's guide, lines close to game time reflect the most up-to-date information, and tracking those late moves is itself a signal (a total still dropping in the final hours means the weather picture kept developing). Cross-book confirmation applies here too: a line move at a market-making book (Circa, Pinnacle) that is followed by other books is a cleaner market-wide signal than a move at a single recreational book, which may reflect only that book's liability management, per oddsreference.com, though the site does not specifically apply this cross-book confirmation principle to weather-driven total moves.
Building a practical weather-reading process before a game
The process starts with a simple filter: identify which games on the slate are actually outdoors. Indoor and retractable-roof venues are non-factors regardless of what the forecast says, the way Jets at Lions at Ford Field gets marked indoors and weather drops out of the equation entirely.
From there, check the opening total and read it for what weather assumption is already baked in. The number itself tells you what the book was pricing at the moment it went up, which sets a baseline for everything that follows. Wind speed is the top variable worth tracking, given how consistently it shows up across both the historical rates and the live examples above, followed by precipitation type and severity, and only then temperature, which matters far less on its own than its reputation suggests. None of this requires predicting the weather better than a meteorologist. It requires knowing which numbers the market hasn't finished digesting yet, and acting while that gap is still open. Step 2: check the opening total and note the implied weather assumption baked in at line release, the number tells you what conditions the book was pricing. Step 3: monitor forecast evolution starting roughly 72 hours out, the 25–48-hour window before kickoff is where forecasts solidify and lines react most, per oddsindex.com.
Methodology & sources
- Line Movement: A 2026 Sports Betting Guide | Outlier
Supported the point that lines near game time reflect the most up-to-date information.
- NFL Weather Today: Forecast & Betting Impact for Every Game
Supplied the wind-band under rates and sample sizes for NFL totals.
- What Is Line Movement? A Data-Driven Guide to Odds Shifts
Provided the closing-line-as-most-efficient-price concept and the cross-book confirmation idea.
- NFL Weather — How Weather Affects NFL Scoring
Backed the points on modern line-setting, the final 24-hour pricing window, and kicking accuracy in wind.
- NFL odds: How bad weather impacts betting lines | FOX Sports
Provided the under win rate for games with 20-plus mph wind since 2015.
- Weather Impact on NFL Betting Outcomes: How to Bet Smarter Based on Weather Conditions
Supplied the rain passing-yard and under figures and the 1.5-point market adjustment in moderate wind.
- How the weather can impact NFL points totals | Football betting tips
Provided under probabilities at 17 and 25 mph and the dome versus outdoor scoring gap.
- NFL Weather Betting Guide: How Weather Affects Spreads, Props & Totals
Supplied the timing of forecast-driven moves, the Chiefs-Bills wind example, and the opening-line process.